Recently we published a number of stories about school enrollment in the Okanagan Similkameen – District 53. Some clarification was requested by ODN and the staff supplied these graphs showing enrollment in 2014, 2015 and 2016 based on months indicated. The charts are not consistent in format
For the purpose of consistency we will refer to FTE’s (full time equivalents) only
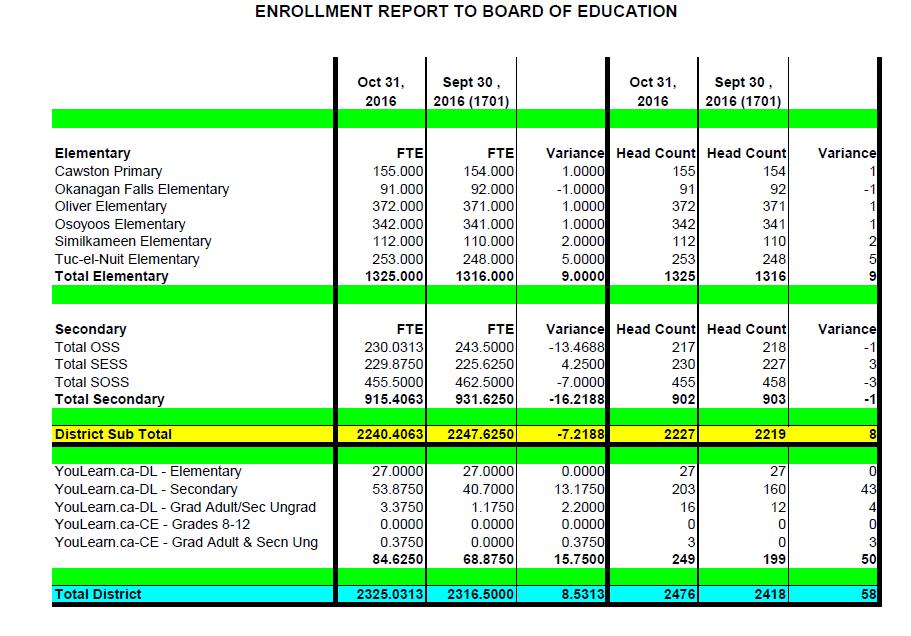
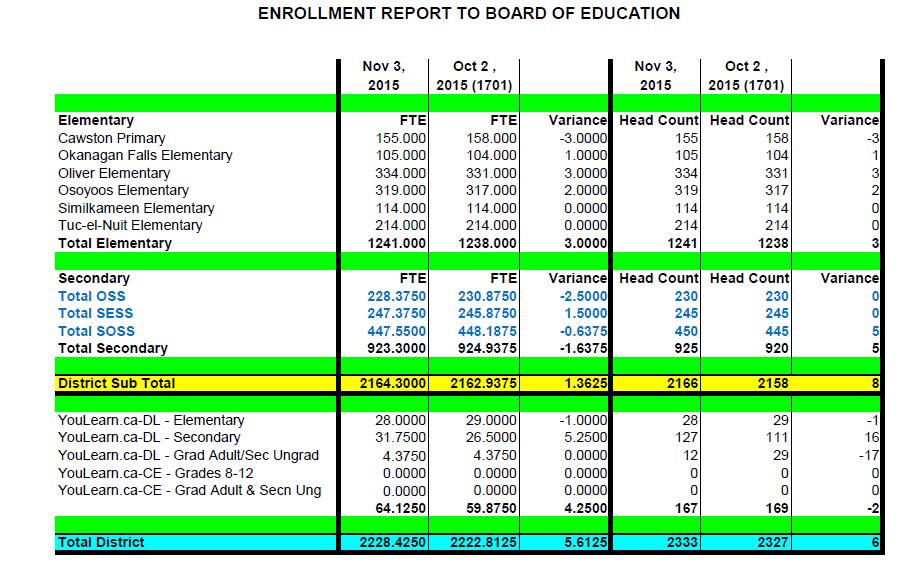
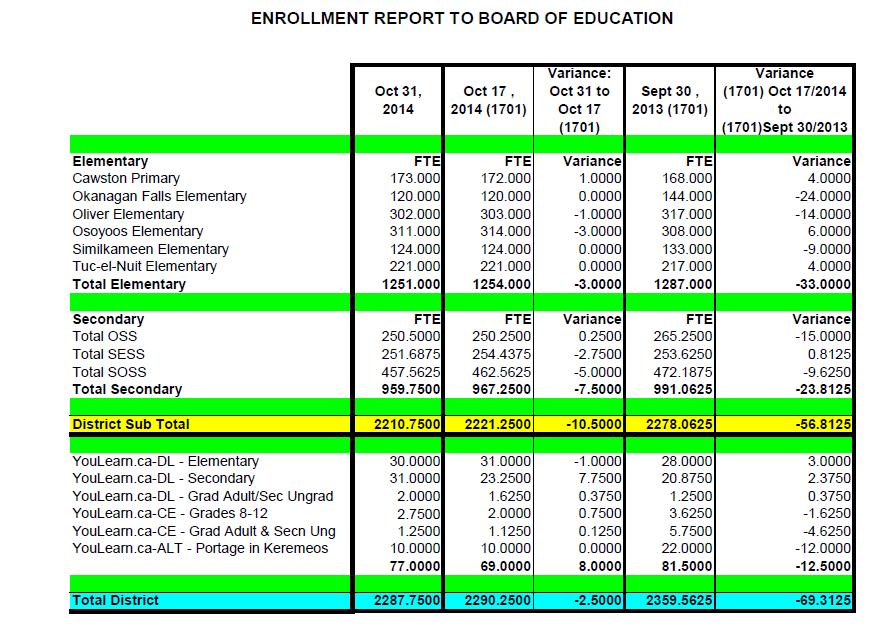
Entire District
2014 – 2287
2015 – 2228
2016 – 2325
Elementary Schools
2014 – 1251
2015 – 1241
2016 – 1325
High Schools
2014 – 959
2015 – 923
2016 – 915
The balance of the numbers (Total minus Elementary and High Schools) is ULearn attendance.
The figures show growth at the elementary school level – district wide and a decline in high school students.
A quick check by any reader will see a rise or drop at a school near you.